
By Griffin Cooper
In the world of trading, understanding, and appreciating the value of variation in market data is crucial for uncovering potential trading opportunities as well as avoiding potential pitfalls. By recognizing the diverse range of market behaviors, traders can develop more effective trading strategies that capitalize on the fluctuations in the market.
One key aspect of appreciating variation in market data is the ability to identify market trends. For instance, recognizing the simple but fundamental difference between bull and bear markets can have huge impact on a trader’s performance by getting them aligned with the overall direction of the market.
In bear markets, where the price is trending down, traders can look for indicators such as the Parabolic Stop and Reverse (PSAR) flip on the SPY, a proxy for the SP500, signaling a downward trend.
Figure 1 below shows the SPY daily chart. Once the PSAR flipped at point A, you can see there were many days where the market had large days moving down measure by both the closing price changes and the intraday open versus closing price.

Figure 1 — SPY Daily chart
For a longer-term perspective, a good method we use in the Owl Group to measure a bear market is with the 200-day simple moving average. When the closing price is two percent or more below the 200-day simple moving average we can classify that as a bear market. In Figure 2, again using a daily chart of SPY, we can see that while the market was in a bear condition (the highlighted area) it tended to move down.
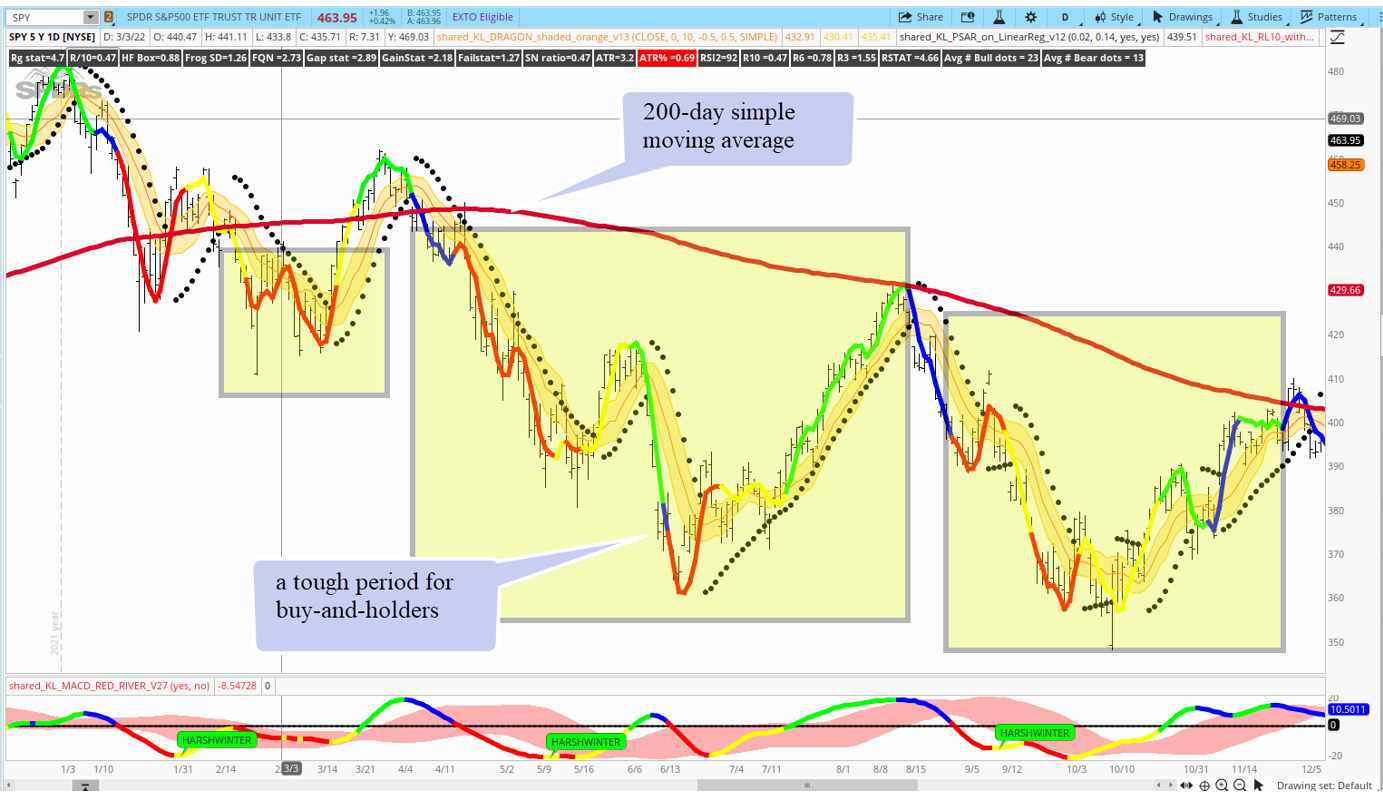
Figure 2 — SPY vs 200-d Simple Moving Average
By having simple market classification systems like this we can develop strategies to suit different market conditions. During uptrends, traders often focus on identifying stronger symbols and targets. Strategies such as swing trading, core positions, and buy and hold of the SP 500 tend to perform well in such market conditions. By recognizing the variations in market behavior, traders can adapt their approach to align with the prevailing trend, thereby enhancing their trading performance.
Conversely, while buy and hold and longer-term position trades do very well in bull markets, they can be difficult during bear markets. But if we have methods to measure these market variations we can simply stay out of the market during those times when it does not align to our strategies. Maybe we can even go a step further.
Suppose our indicators have signaled we are in a “down market.” We can focus and develop a strategy to exploit those specific market conditions. During downtrends, the “red zone short” strategy presents a compelling opportunity for traders. This strategy involves taking an intraday short position when a symbol is below yesterday’s low of the day, allowing traders to capitalize on the downward momentum in the market.
Figure 3 shows an intraday trade using the “red zone short” strategy on TSLA, a common symbol we use for intraday trading. Knowing the market was in a downtrend, we looked for symbols that had made a large move down intraday. After waiting patiently for pullback, we were able to enter a short trade on a low-risk idea.

Figure 3 — TSLA short entry below yesterday’s low of the day
Knowing we were in a downward-trending market gave us an additional edge and a higher probability of the trade working in our favor. The main takeaway from appreciating the value of variation in market data is to be aware of the fluctuations in the overall market, have a reliable method to gauge and measure these variations, and develop a systematic approach to exploit them. By incorporating these principles into their trading strategies, traders can position themselves to capitalize on the dynamic nature of the market and potentially achieve more favorable trading outcomes.