
By Griffin Cooper

One thing I really love about the Kata Challenge System patterns is how robust and pragmatic they are. They are all unique to a certain type of price action while being flexible and simple enough that they can be applied to a variety of situations. In the same way a Continental grip in tennis can be used for both serving and volleying at the net, or a wedge can be used for different scenarios in golf, the Kata Challenge patterns can be traded effectively in different contexts. The more we practice them, the more we get to know them and all their variations.
The case study here is arguably our best pattern (and the creator of the pattern Dr. Ken Long’s favorite), the Collapsing Dragon or CD pattern. The most common application for the CD pattern is when price is falling or in a downtrend. When price makes a sharp move down, the most probable move to see next is a second leg down where the bears assert more control and gain more strength while the bulls abandon their positions as they see lower lows and no sign of upward pressure.
Stepping back, we recall that at the heart of all technical analysis is the process of finding trends and finding trend reversals. The three Kata Challenge patterns also seek to do this while at the same time giving actionable entries and exits. Previously we talked about how the CD pattern can be used to ride a downward trend. But the CD can also be used for a reversal topping pattern.
One common reversal that can happen is when we see a steep run up price, often at the beginning of the session if it is intraday, that will make a series of two lower highs before a sharp pullback. Chartists would refer to this as a “descending triangle” (see figure A).
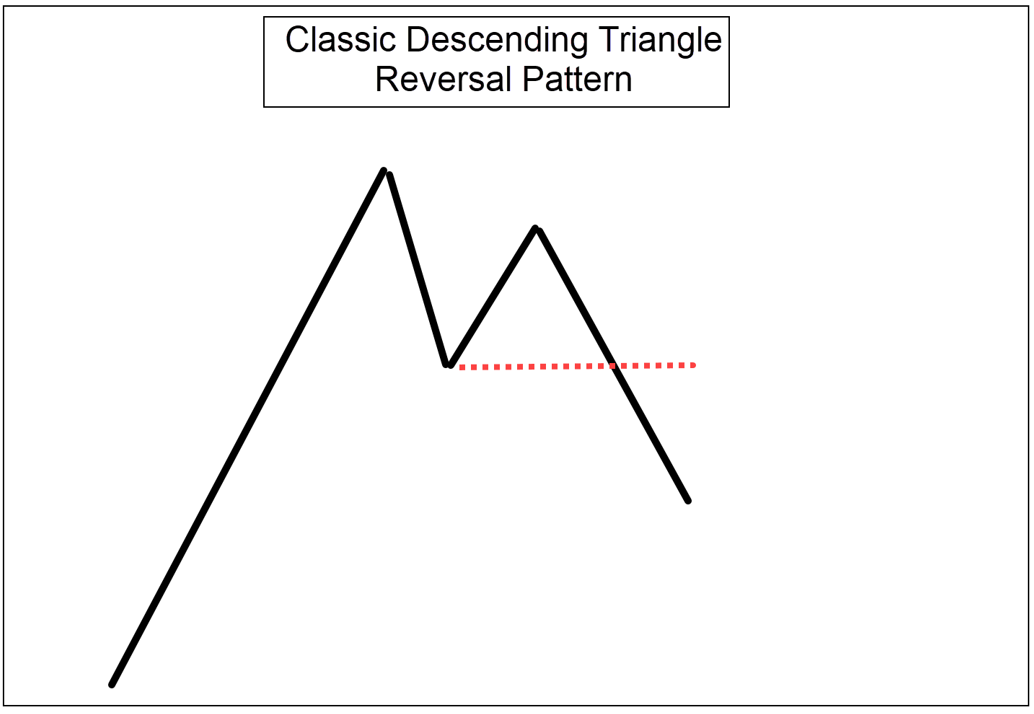
Figure A
When we use our usual set of indicators that we employ in the Owl Group, this pattern can easily be spotted by the quick change of direction of the regression line and two lower ‘humps’ formed before the PSAR flips to the short side as price crosses our “dragon” indicator.
The pattern has more confirmation if the reversal takes place at an established resistance level. One of my favorite support and resistance pivot points intraday is the high and low of the previous session. In Figure B, we see a recent trade example in DIA where price did its morning run-up before reversing with a collapsing dragon pattern at the top.
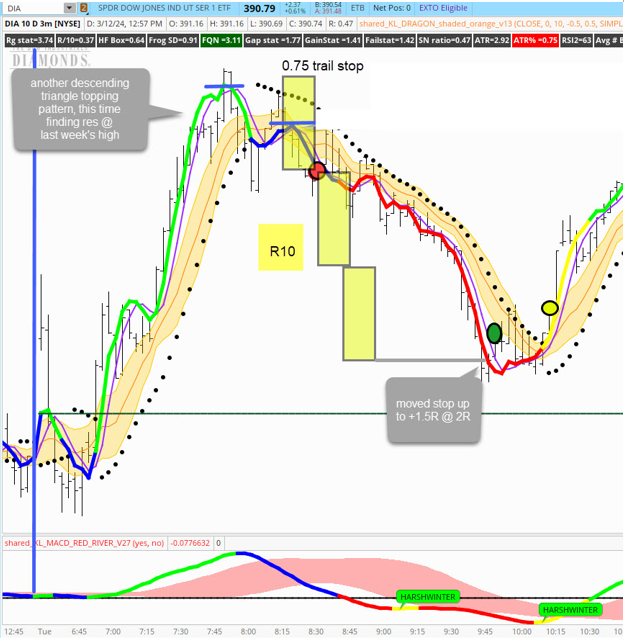
Figure B
Figure C highlights another case study, this time in EWW. The same pattern occurs, this one having the added confirmation of the reversal happening at the resistance level of the previous session’s high.

Figure C
DIA and EWW, are two of the symbols we teach and trade in our Applied Systems Development course where we do a six-week Kata Challenge Workshop as part of our 12 week program at AbleWayTech.com.. These are symbols that have worked for years in our trading due in large part to their reliability and frequent signals that fit our directional style of trading very well.
The more we study these patterns, the more we find them occurring over and over again. It’s truly fascinating to dive deeply into these patterns to see how they capture the psychology of market participants.