By Griffin Cooper
Practicing sketches of chart patterns can be a very good skill for a trader to acquire. I like to use the practice of sketching trading patterns to better understand the logic of new patterns I’m studying, and also to better internalize the patterns so I can recognize them quickly.
Using a Sketching Mindset:
• Sketching patterns when the market is closed allows me to approach it in a calm, relaxed and objective state of mind.
• By making a drawing of a new pattern I’m interested in, I can better understand the logic of it and gain new insights into why I’m attracted to it.
• After repeatedly sketching a pattern, I can more easily identify and trade the pattern when it appears in live real-time price action.
All of my best insights and progress in trading seem to happen when the market is closed during the assessment phase. During these times I can take a more calm, objective perspective of price action. One thing I’ve found very useful is to sketch out on paper the trading patterns I’m studying. This can be especially helpful if it’s a new pattern that I haven’t actually traded before. I like to say, “If I can draw it, I can trade it.”
There are many examples of the value and benefits of repetitive sketching outside of. In Japanese calligraphy, artists practice a process called “Shuji” where they start by learning the basic strokes and forms of each character or letter. They then practice writing these forms repeatedly, sometimes for hours or even days at a time. This process of repetition is essential for developing muscle memory and achieving the proper balance and flow in each stroke. It also allows the artist to internalize the character or letter and understand its meaning on a deeper level. This certainly speaks to the artistic side of trading.
Steps to the Ceiling
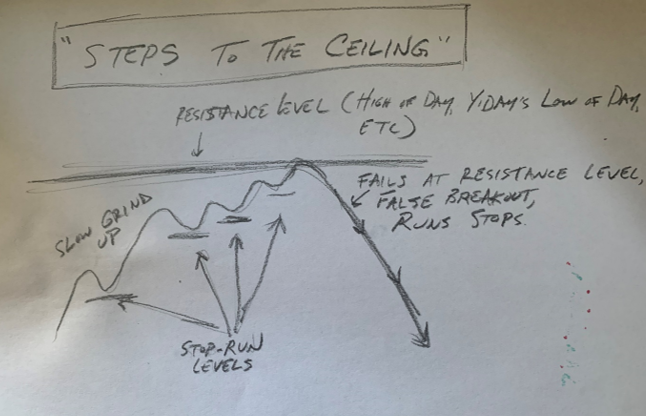
Here is a sketch I did recently for a new pattern I’m studying that I call ‘Steps to the Ceiling”. It was a pattern I had noticed a few times during my assessments. I decided to sketch out the concept of it to gain more understanding of what I liked about it. By drawing it out I saw that it identified a slow climb up in price (steps) to an established resistance level (the ceiling). If price bounced off the resistance level, the series of lows from the climb up in price created a bunch of stop-run levels that could lead to a quick move in my favor.
EWZ on 3 min
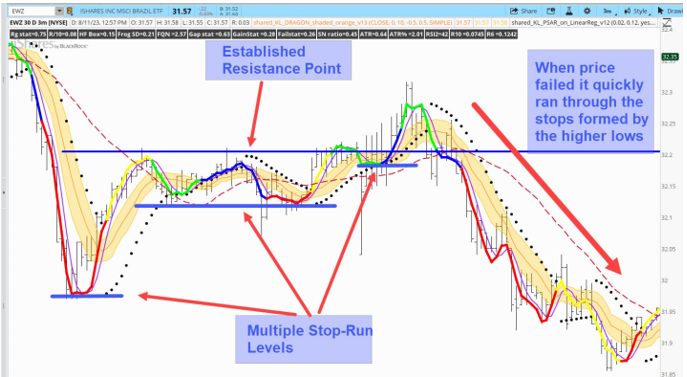
Here’s an example of the same setup with real price action. This was seen in a common symbol we trade, EWZ on the 3-minute timeframe. By first sketching out the pattern on paper, I’m able to identify it more accurately in real-time trading.
Practicing patterns by sketching them out on paper can be an unexpected but beneficial way to access the artistic side of our trading skills and become a more well-rounded trader.


